

Data analysis and charts
When a question needs actual computation, grouping and summarizing data, running statistics, plotting a trend, Sparkian detects that and runs Python behind the scenes to work out the real answer.
What triggers it
This is automatic, based on intent. Asking for something that needs visualization, calculation, or chart analysis is enough for Sparkian to reach for Python on its own.
Supported data
Upload a CSV or Excel (.xlsx) file, or just paste data directly into your message, see supported file types for the full list of what you can attach.
Reviewing the work
Each response that used this shows a collapsible Ran Python · N calculation(s) step above the answer. Expand it to see the exact code that ran and its output.
If a calculation errors, Sparkian automatically retries with a fix. You’ll see more than one calculation listed on responses where that happened.
Charts
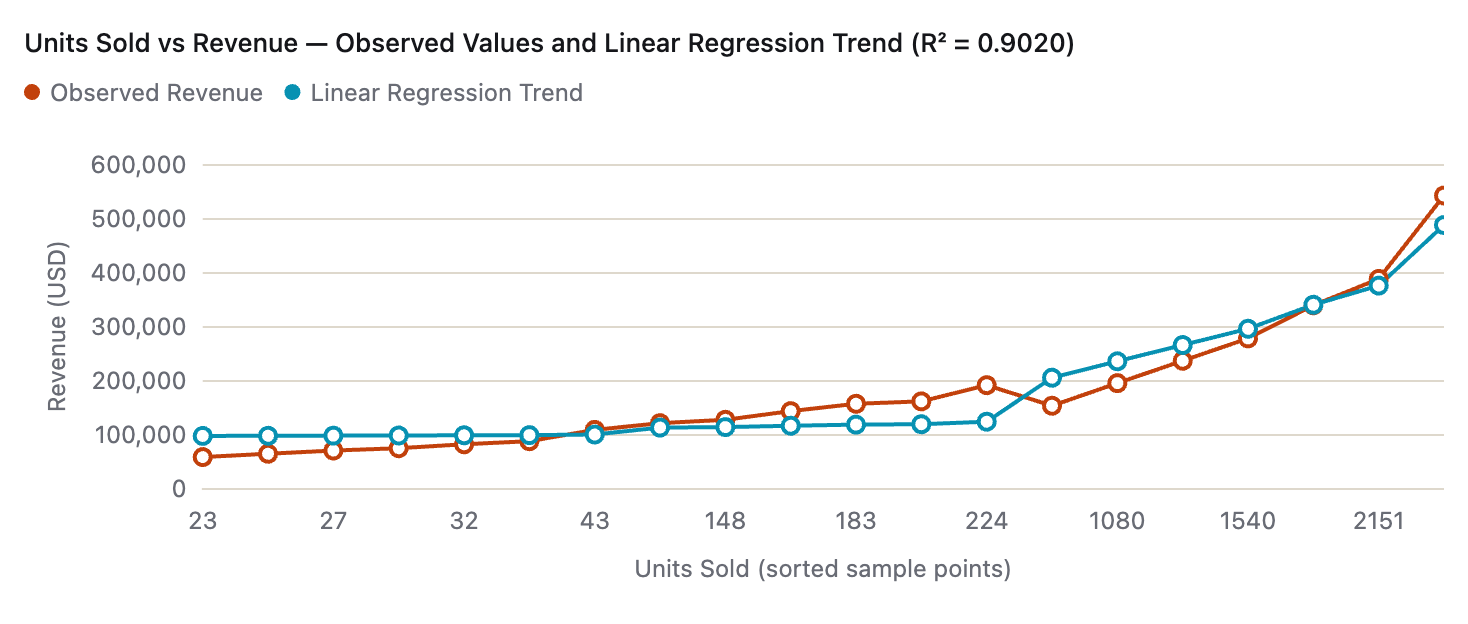
Charts render inline as part of the response, with their own copy and download actions, same as Mermaid diagrams.